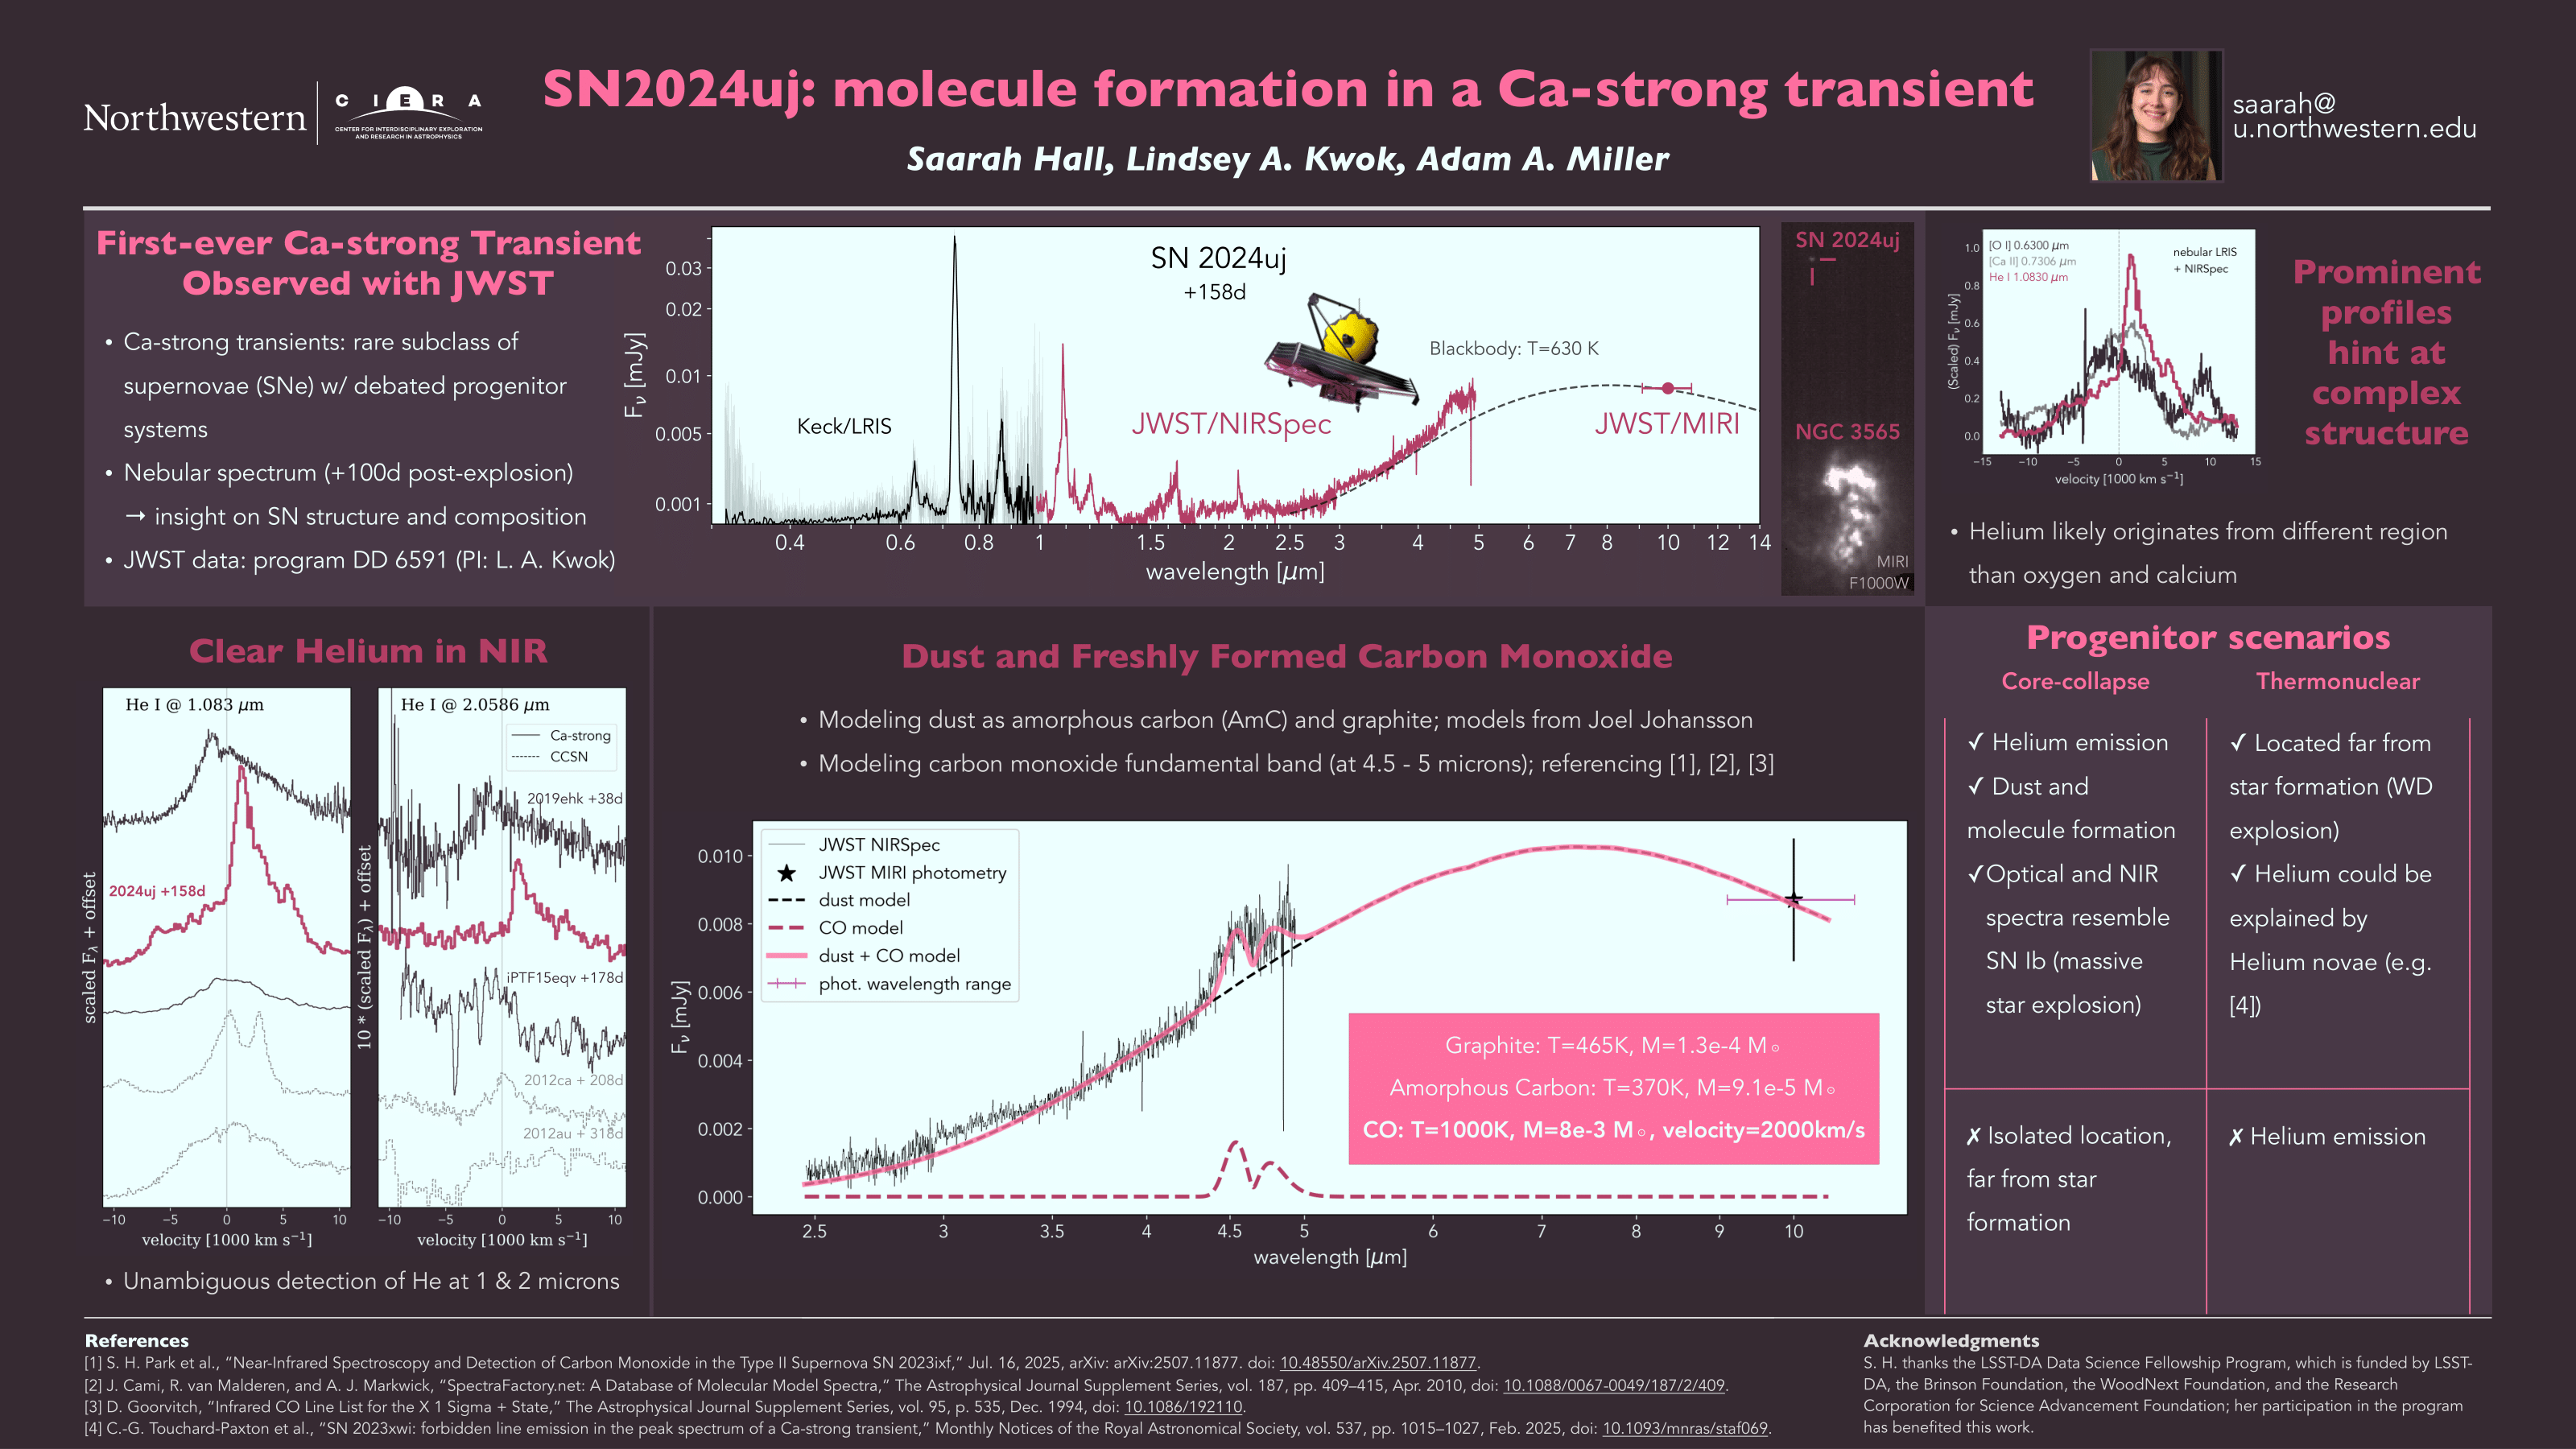
Studying a Calcium-strong Transient with JWST
2025-Present; Northwestern; Advisors: Dr. Lindsey Kwok and Prof. Adam Miller
Description coming soon! While you wait, here is a poster I presented at the 100 Years of Supernovae (SN100) Conference in Stockholm:
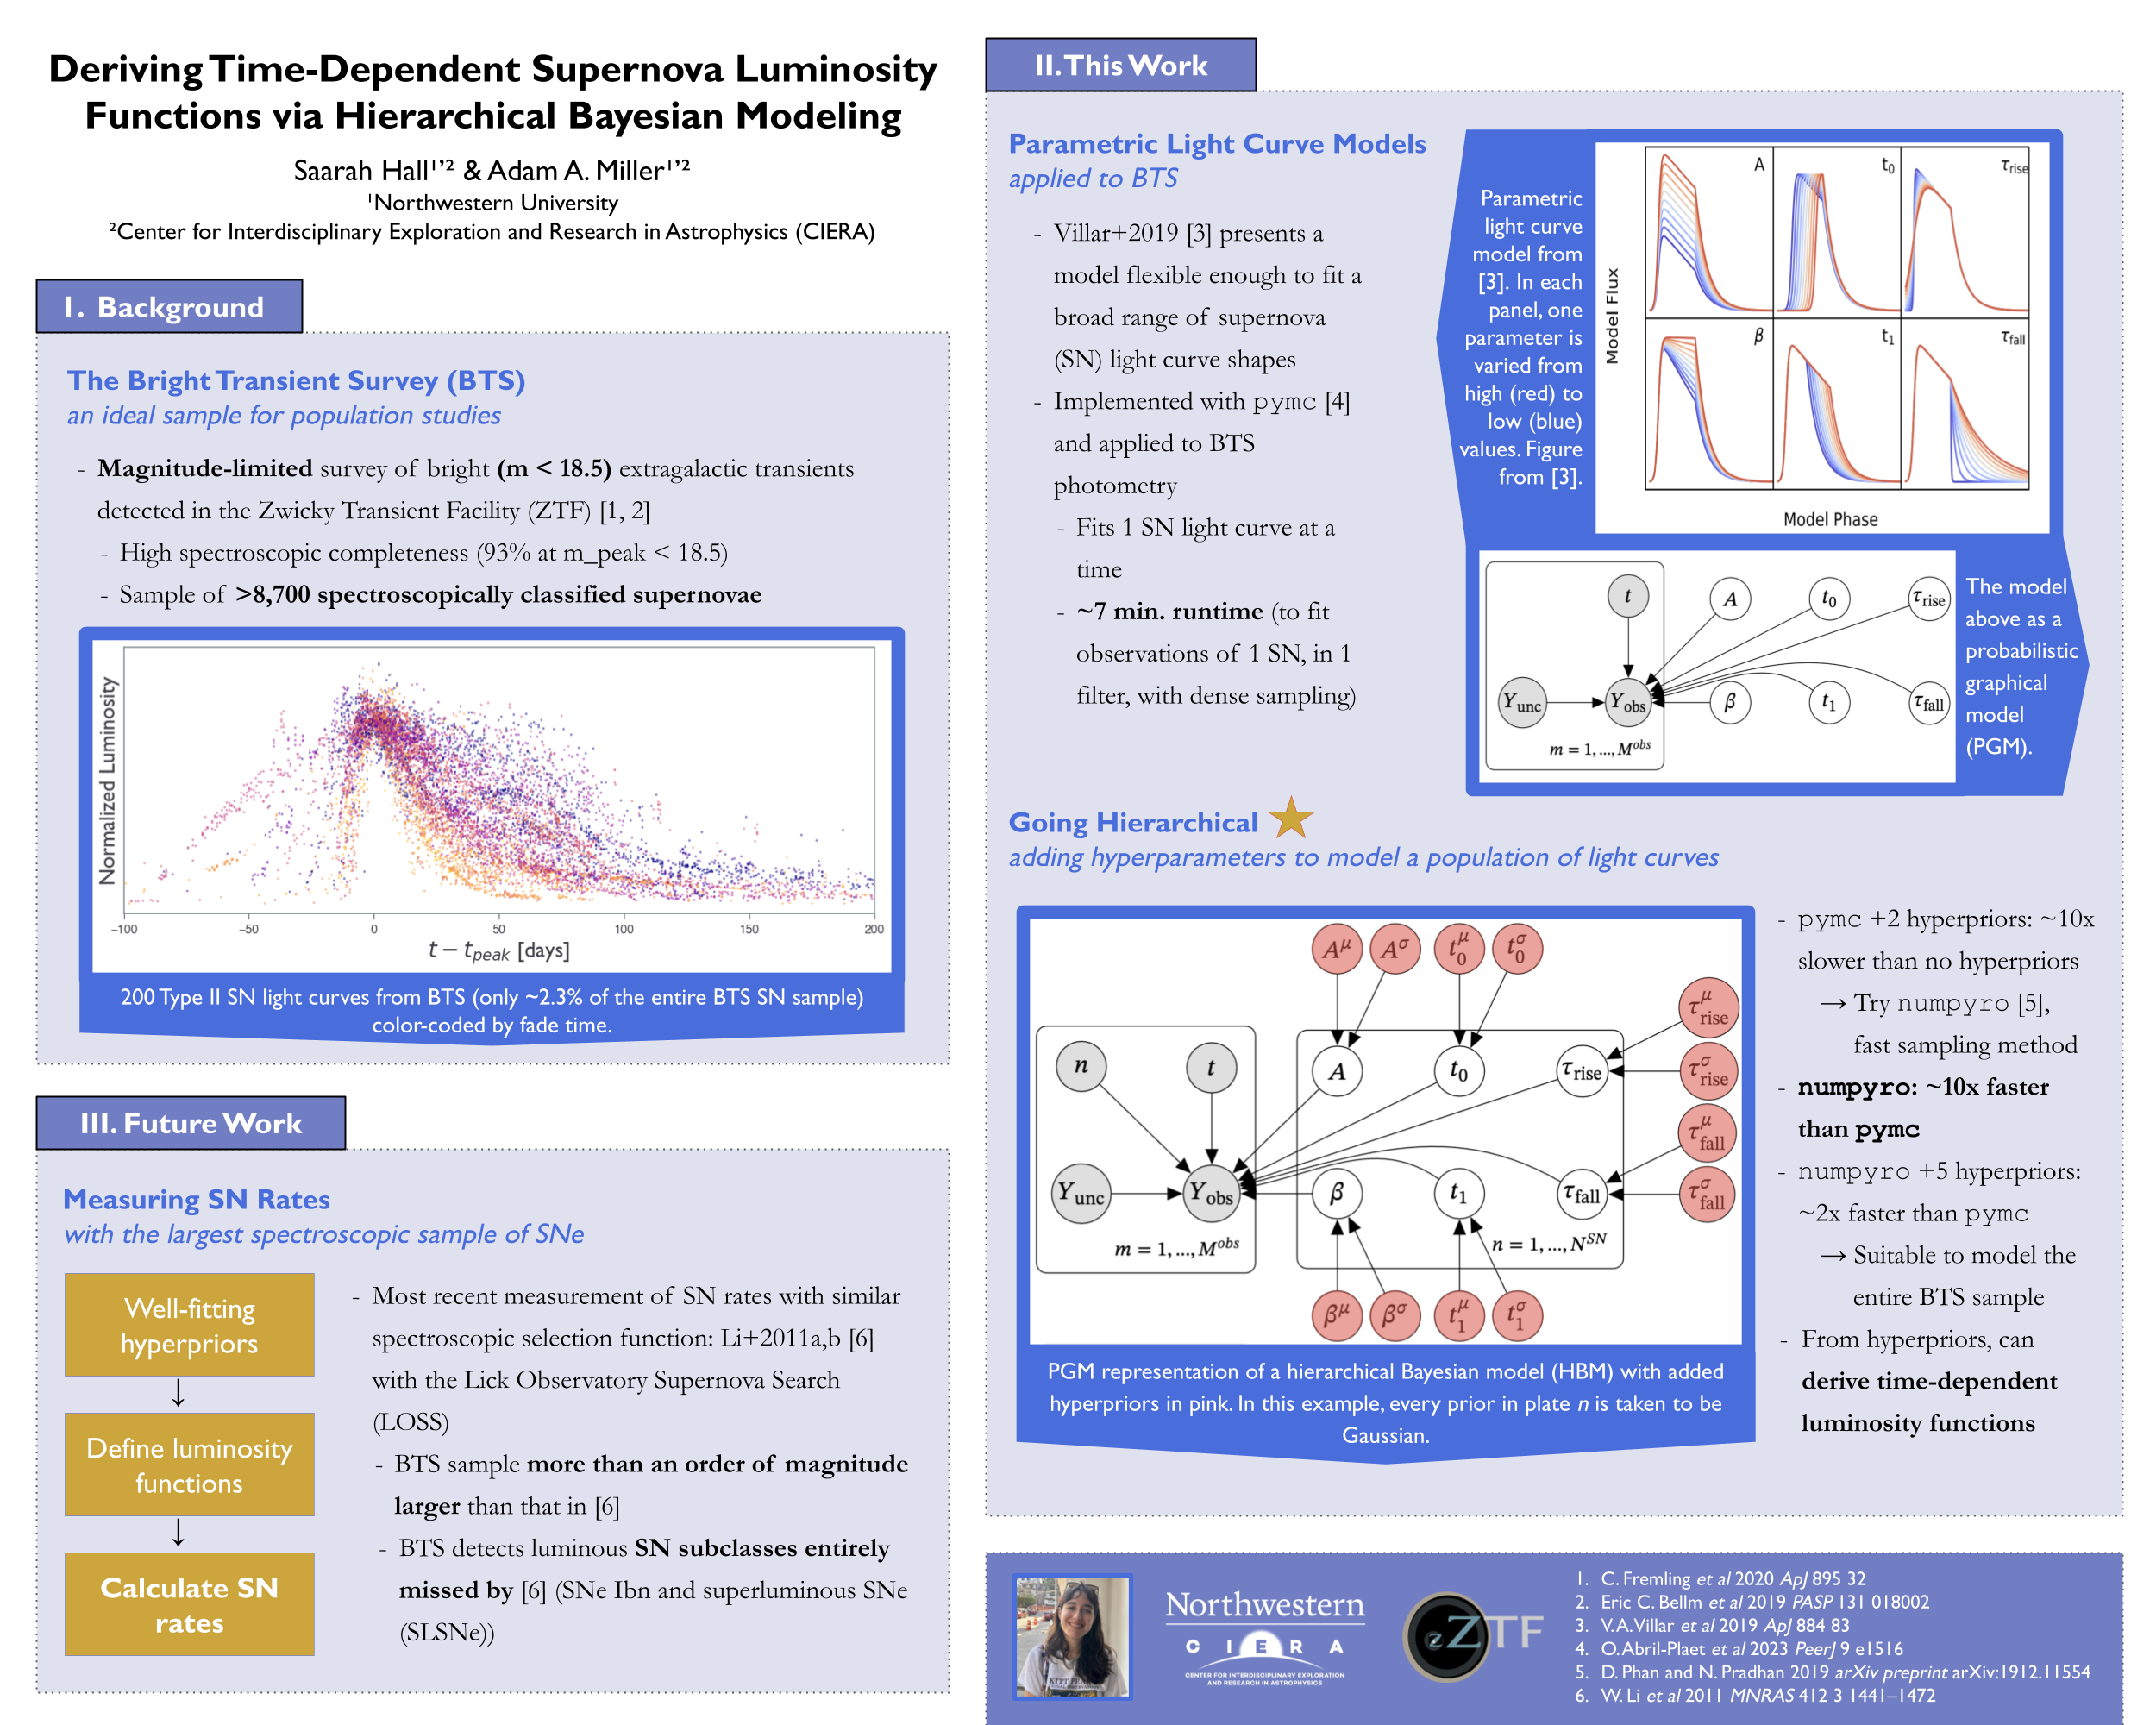
Hierarchically Modeling BTS Supernovae
2024-2025; Northwestern; Advisor: Prof. Adam Miller
Description coming soon! While you wait, here is a poster I presented at the Rise_Time conference at Purdue:
Data Reduction Pipeline for SEDMv2
2022-2025; Northwestern; Advisor: Prof. Adam Miller
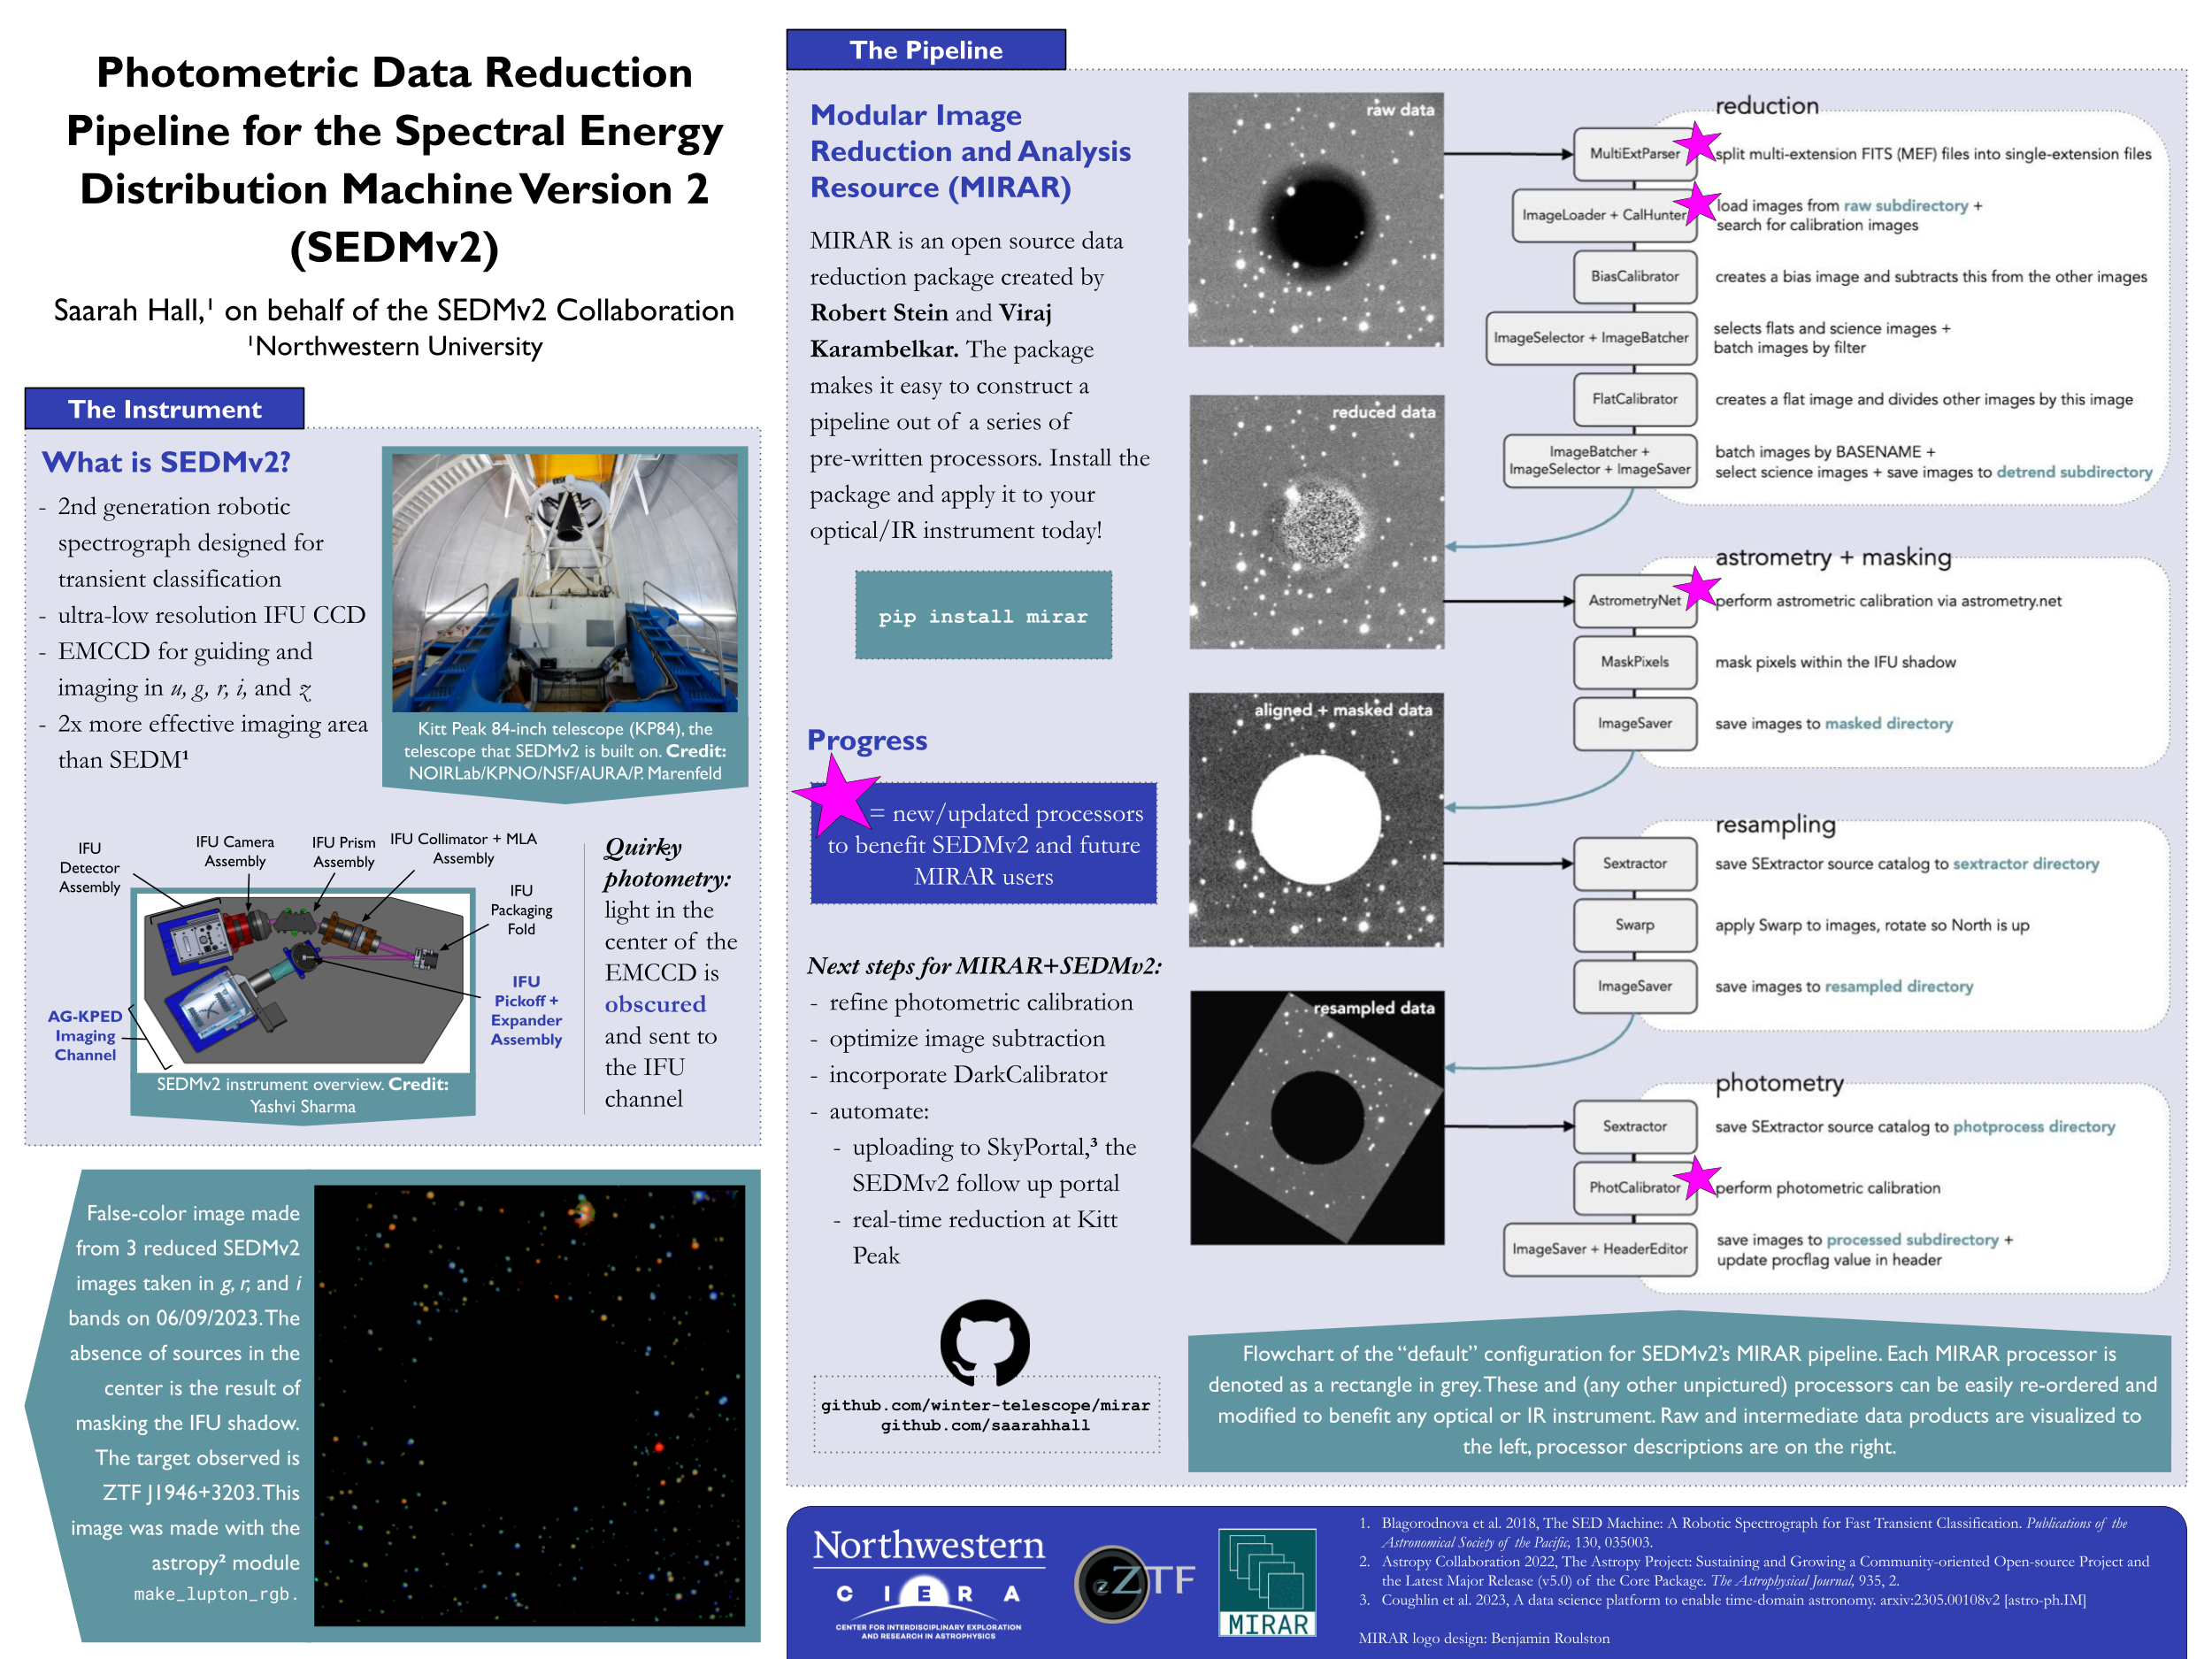
I am the lead developer of the pipeline that processes photometric data from the Spectral Energy Distribution Machine version 2 (SEDMv2), an instrument that observes interesting transients (e.g. supernovae) detected by the Zwicky Transient Facility (ZTF). SEDMv2 was modeled after the original SEDM, a robotic instrument that has been in operation since the start of the ZTF survey in 2018. SEDM faces an oversubscription problem (more transients are detected in a given night than SEDM is able to "follow-up" on), which motivated the construction of SEDMv2. The pipeline that I developed is described in the iPoster above (presented at the Transient and Variable Universe Conference at UIUC), and lives on github.
MIRAR: a pipeline-building tool
In the process of developing the data reduction pipeline for SEDMv2, I was also a co-developer for the open-source software package MIRAR (the Modular Image Reduction and Analysis Resource). MIRAR allows users to develop pipelines to process data from the imaging instruments of their choice without having to start from scratch. MIRAR is the wrapper around the pipeline for SEDMv2, as well as several IR instruments, including WINTER. MIRAR lives on github and zenodo.
SEDMv2 on Kitt Peak
When I first joined the SEDMv2 team, the instrument had just been installed onto the 2.1 meter telescope on Kitt Peak. I visited the dome twice to work on / observe with the instrument, and it's also where I saw the galactic center for the first time: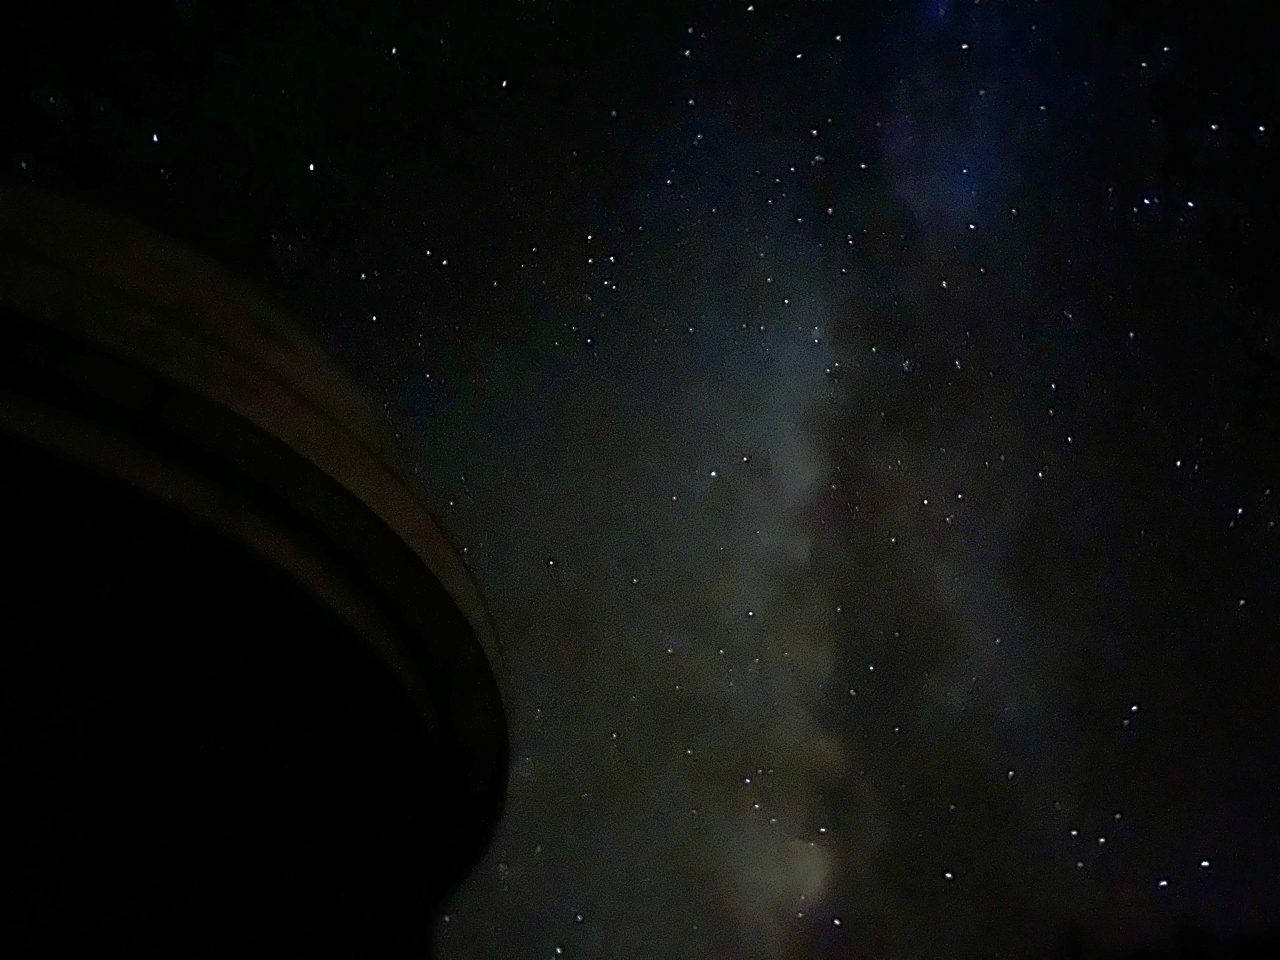
Scene Modeling Photometry on High-Proper-Motion Stars
2021-2022; UPenn; Advisor: Prof. Gary Bernstein
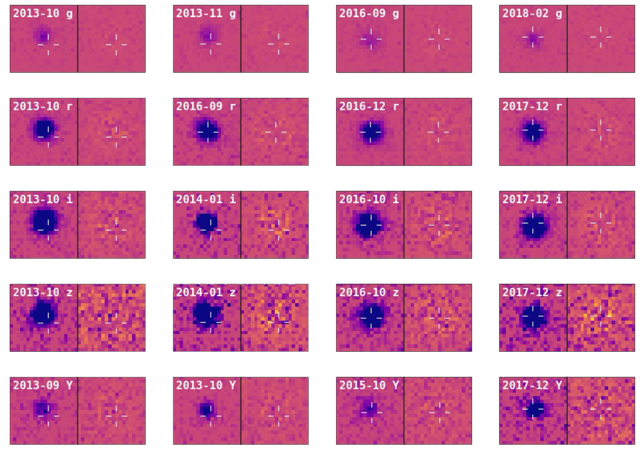
For my my senior honors thesis, I developed a model that obtains accurate measurements of fast-moving (high-proper-motion; HPM) stars present in Dark Energy Survey (DES) data. The technique I used is called scene modeling photometry (SMP), which is great for obtaining precise photometric measurements, thus building upon previous work of applying SMP to the modeling of supernovae (SNe) in DES. This SMP method is advantageous when studying moving objects because the model takes their motions into account by running on single exposures taken at different times and solving for position-related parameters and flux simultaneously. This is a critical improvement on previous DES methods since DES flux measurements are classically run on “co-add” images (many exposures stacked together), causing HPM stars to appear as smears across the image that are then mischaracterized in flux. Additionally, when this SMP tool is paired with the Dark Energy Camera’s large size and long exposures, we are able to precisely characterize HPM stars that are too faint to be detected by Gaia, a leading instrument in high-precision photometry, such as ultra-cool brown dwarfs and isolated neutron stars.
Optical Counterparts to Gravitational Wave Events
Summer 2021; Northwestern CIERA REU; Advisors: Prof. Wen-fai Fong and Dr. Kerry Paterson
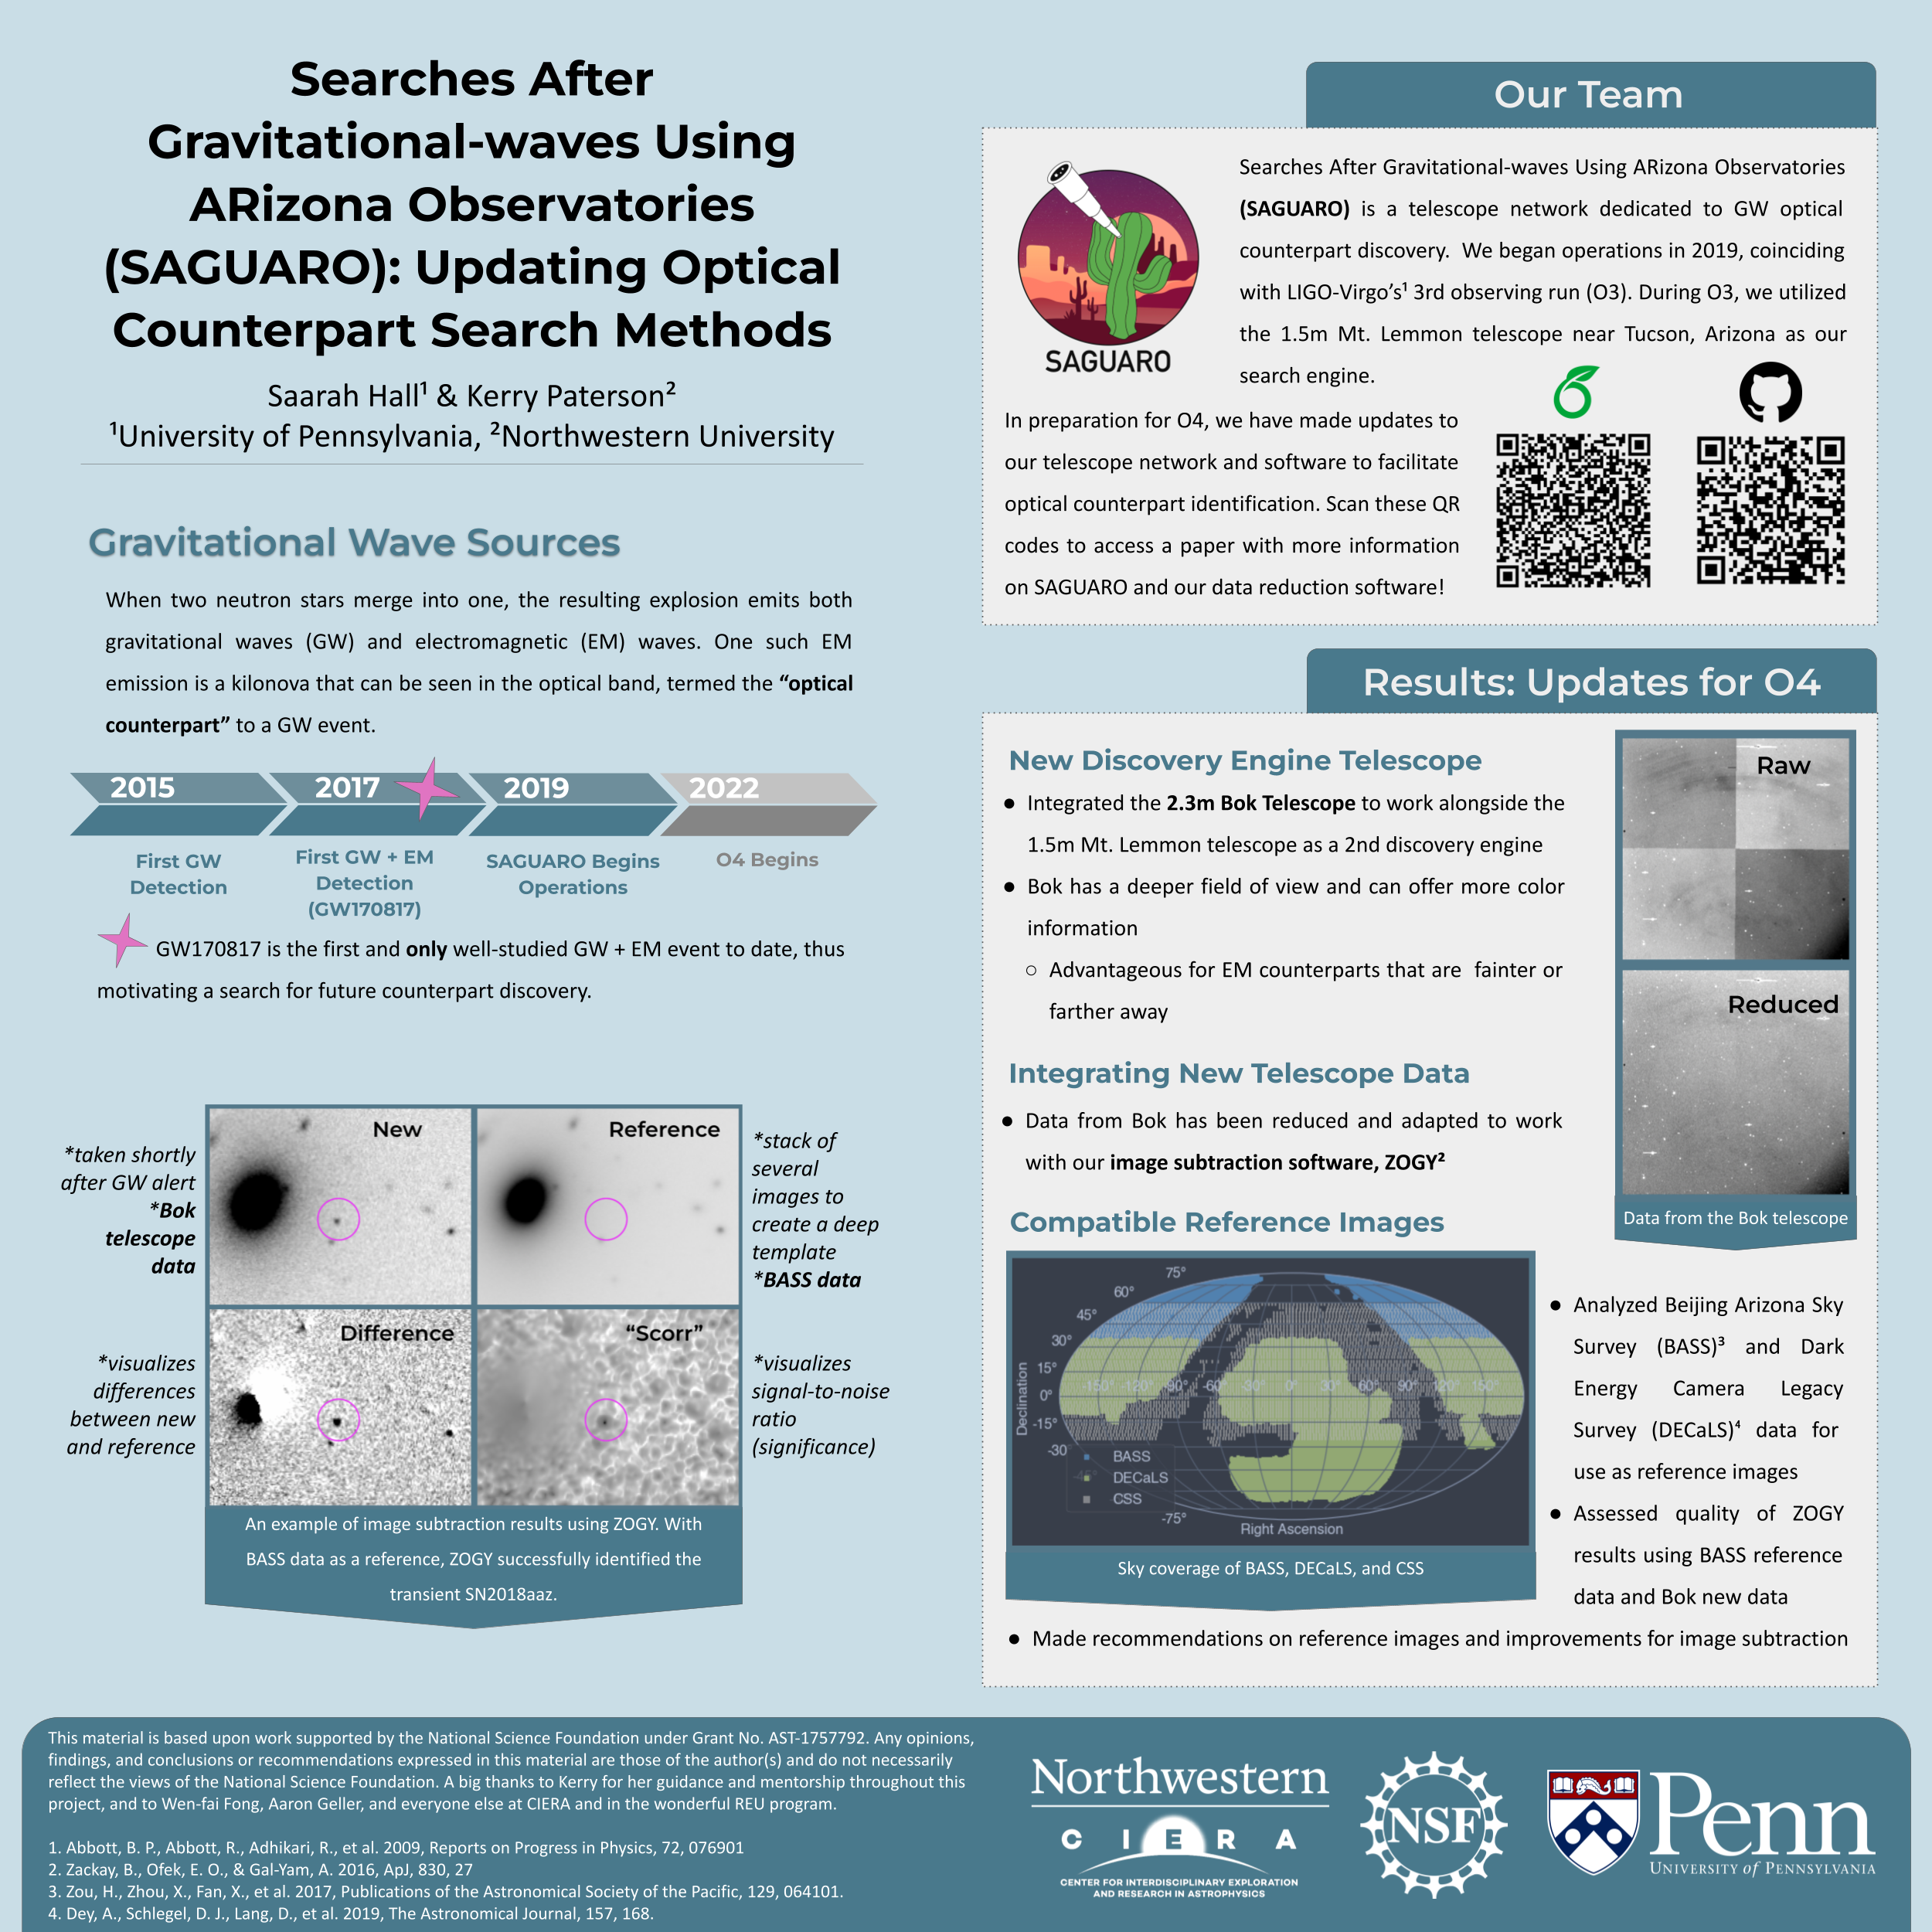
As part of the SAGUARO team, I developed software that would aid us in the search for electromagnetic (EM) counterparts to gravitational wave (GW) events. The EM counterparts in question, kilonovae (KNe), are rapidly dimming transients that follow the mergers of neutron stars and/or black hole, which produce gravitational waves. These elusive transients are hard to catch (their optical signals vanish within hours to a day), but the physics insights they unlock are worth the chase.
My goal was to integrate a second telescope, the 90-inch Bok telescope on Kitt Peak, into SAGUARO's network to increase the chances of observing an EM counterpart when following up on GW detections. With this additional telescope, we are able to probe fainter and farther sources and scan a larger area of the sky within the short window of time the KN would be observable. To accomplish this, I wrote Python code to process the new telescope’s data and prepare it for the first step in our KN candidate vetting process, image subtraction. I also tested the performance of our image subtraction software to ensure that a real KN would be identified by our pipeline when analyzing data from Bok.
I presented this work at the 240th Meeting of the American Astronomical Society (AAS) with the iPoster above, on this research website through the REU, and I am an author on two related papers: Rastinejad et al. 2022 and Hosseinzadeh et al. 2024.
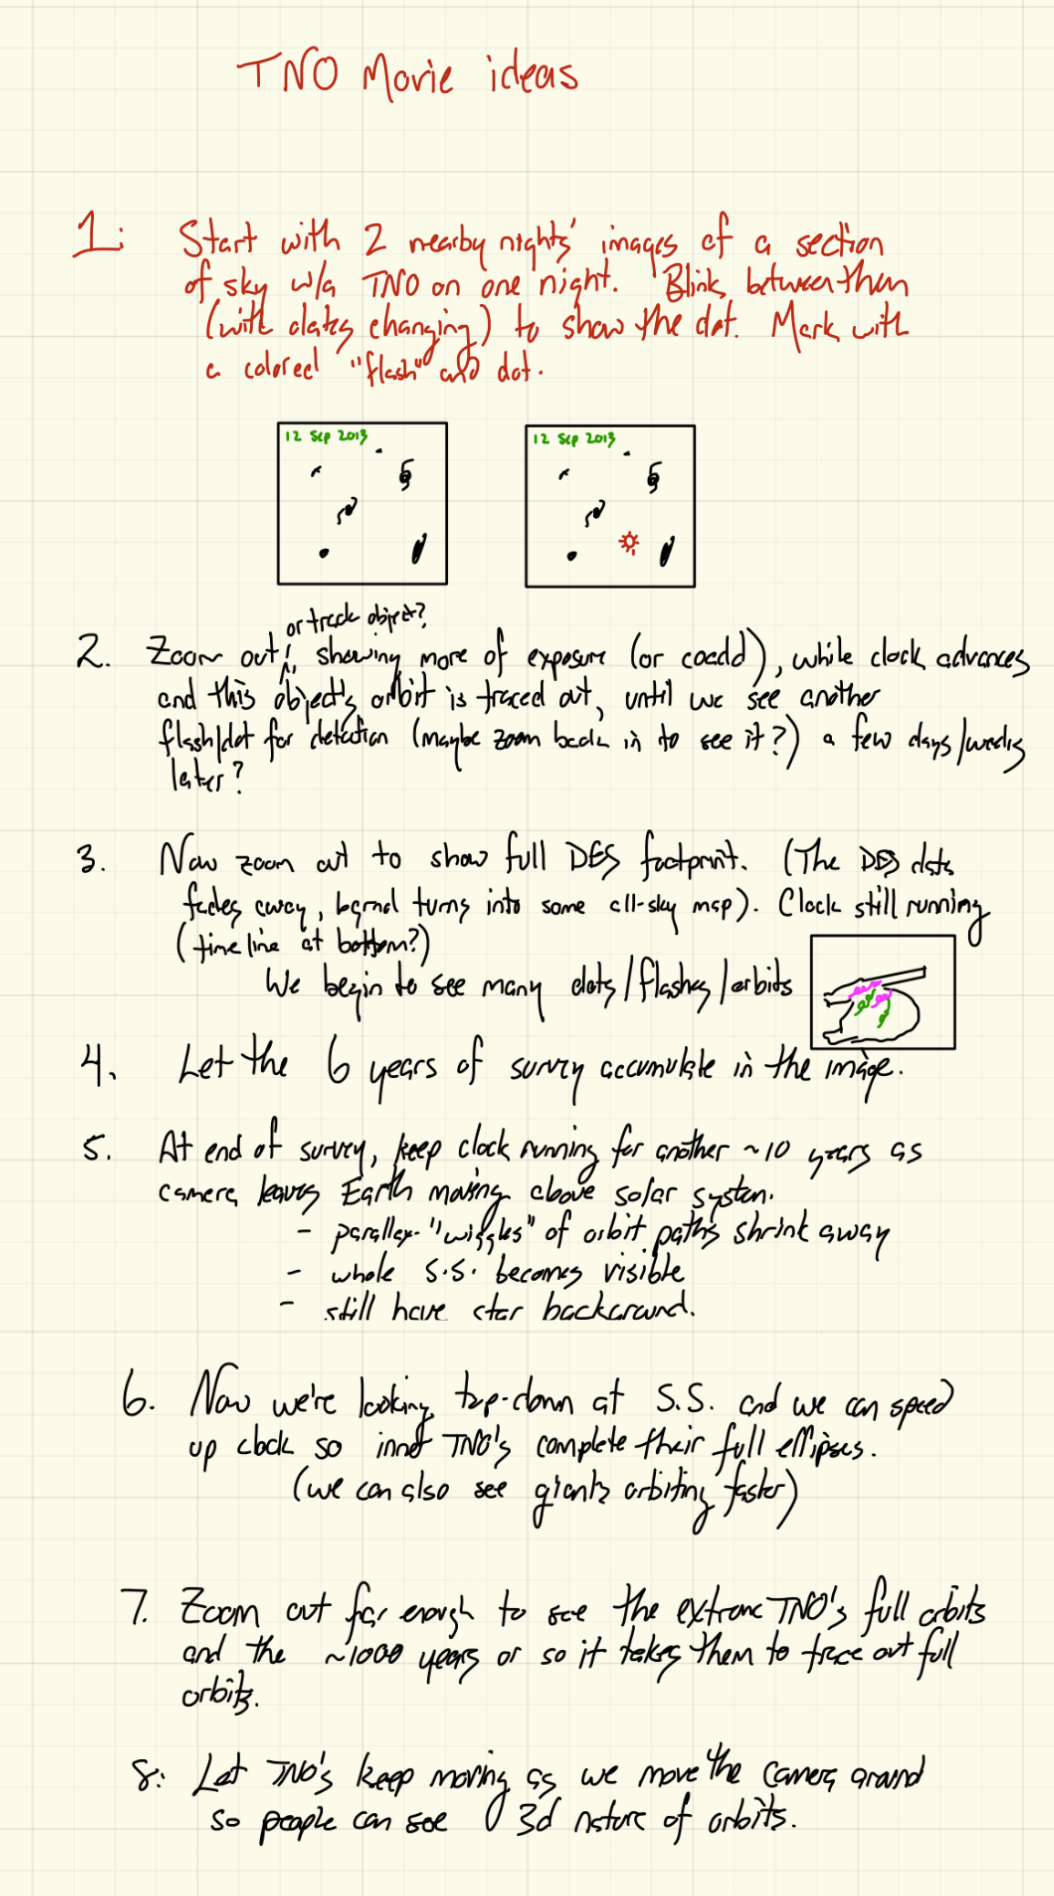
Animating Trans-Neptunian Objects
2020-2021; UPenn; Advisor: Prof. Gary Bernstein
In my first research project, I utilized data from the Dark Energy Survey to create a comprehensive “movie” about Trans-Neptunian Objects (TNOs), the icy bodies orbiting our Sun beyond Neptune. At that point, the 800+ TNOs existed primarily as numerical data in a table. My work offered a never-before-seen view of TNOs moving through the solar system over thousands of years.
The movie itself, which is made entirely out of (thousands of) Matplotlib frames, is embedded above!!
I presented this movie at a DES transients working group meeting, a collaboration-wide DES video conference, and to an audience of scientists and non-scientists alike at the thesis defense of Pedro Bernardinelli, the student who originally compiled this data.
This was the perfect first project for me - it was a crash course in Python data visualization (I had no coding experience at the time), and a beautiful mix of astronomy and art (Prof. Bernstein came up with the project knowing that I was also working as a video editor at the Singh Center)! If you're really interested, I documented my progress in this lab journal as part of Penn's P&A Undergraduate Summer Research Academy. (It's a bit of time capsule for what life was like in the covid-era as a newbie researcher.)